When to Anuitize
This note is very graph heavy, so before your eyes glaze over looking at many figures that all look just about the same, I want to skip to the conclusion and focus on the one figure that really matters.
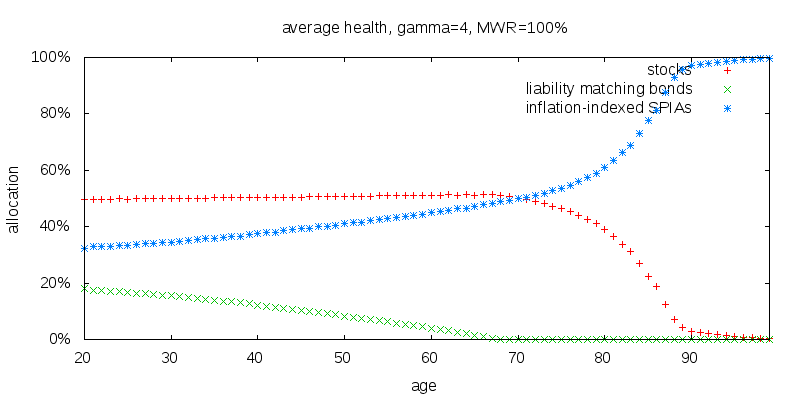
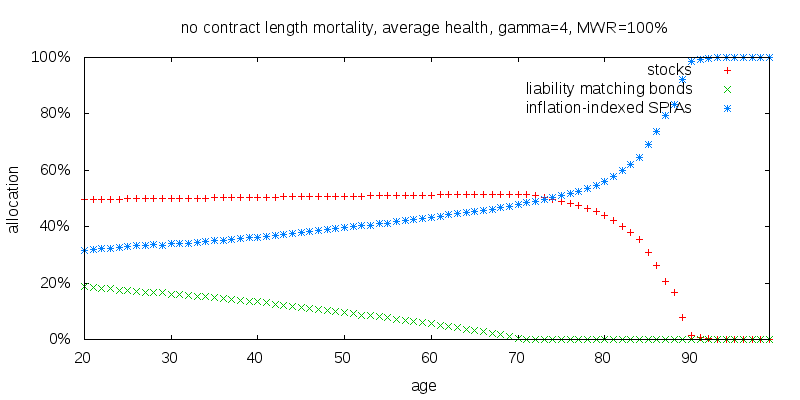
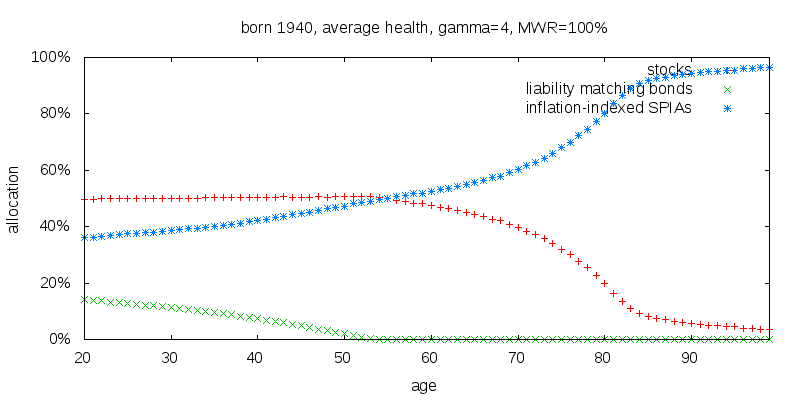
What this shows is the recommended allocation between stocks, liability matching bonds, and inflation-indexed SPIAs for an individual that currently holds no SPIAs. Suspend for a moment the fact annuities can't reasonably be bought in small annual amounts. I will suppose they can so that the optimal strategy can be discerned. Later I will consider breaking the annuitization process up into a small number of discrete chunks. Also don't get too hung up by my use of liability matching bonds. A regular nominal non-long term bond fund would do fine. It is just that in the present economic environment liability matching bonds appear to have a small edge.
The above plot, and all the plots I will show are for an individual that receives or will be receiving no Social Security or other defined benefits. This is very important. Receiving Social Security is very similar to receiving income from an inflation-indexed SPIA, and the value of Social Security needs to be factored in as part of the overall allocations of an individual.
Stocks are constant until you reach age 68, and decline to close to zero at age 89. The early constancy of stocks is consistent with the findings of Merton that the optimal asset allocation is a static asset allocation. The small allocation after age 90 is an artifact of the model in which first any SPIAs are purchased, the first payout is received, consumption occurs, and finally the remaining wealth is allocated between stocks and bonds. The tail is the amount of the first payout less consumption getting carried over into the next time period unable to be annuitized in the model.
Liability matching bonds, that is inflation-indexed zero coupon bonds with a duration based on your retirement life expectancy, start out at 18% at age 20, decline fairly steadily, and are fully annuitized by age 68. The possibility of performing early annuitization of the bond portion of a portfolio isn't well known. Liability matching bonds and inflation-indexed immediate annuities are priced using the same real yield curve. So putting aside the issue of contract duration pricing effects, one might wonder why any liability matching bonds at all, why not just stocks and SPIAs? Indeed a plot of just liability matching bonds and just SPIAs is 100% SPIAs. I suspect the answer to why adding stocks to the mix increases the holdings of liability matching bonds, is bonds enable the portfolio to rebalance, which is not possible with SPIAs.
Inflation-indexed immediate annuities start of at 32% at age 20, increasing to close to 100% by age 90. When liability matching bonds go to zero, the annuitization of stocks starts to take off, meaning that the annuitization curve is smooth at age 68. An explanation of this smoothness is that from the perspective of the SPIAs a higher and higher rate of return is required from the rest of the portfolio to be competitive with SPIAs. This is achieved by decreasing the bond fraction, until it reaches zero, at which point the stock fraction starts to reduce.
In earlier work (see Figure 6 of Floor and Upside Investing in Retirement with Nominal SPIAs) I found bonds should be 50% annuitized by age 45, and fully annuitized at 60, and stocks 50% annuitized by age 70, and fully annuitized by age 80. This study also suggests early annuitization of the bond portfolio, and later annuitization of the stock portfolio. What makes the present study, and the results here slightly different, is the focus on liability matching bonds, rather than nominal bonds returning 3.1% +/- 9.7% which isn't realistic in the present interest rate environment, and if it is ever realistic the price of annuities will also change; the use of constant Money's Worth Ratios (MWRs) in the present study, whereas the previous study attempted to more closely represent the observed increased MWRs at advanced ages, making annuitization there more attractive; and the use of inflation-indexed SPIAs rather than the nominal SPIAs in the study cited.
Details
The results were computed using stochastic dynamic programming. All calculations were performed in, and results are given in, real terms.
- Sex: male.
- Marital status: single.
- Hypothetically born: 2016.
- Lifespan: based on the U.S. Social Security Administration Actuarial Study No. 120 cohort tables.
- Retirement age: for pedagogical purposes results are shown for a retirement age pushed all the way back to age 0; this does not affect the generality of the results for a retiree; for a pre-retiree it only makes a small difference as will be explored later.
- Utility of consumption: constant relative risk aversion, with a coefficient of relative risk aversion, γ, of 4.; many economists suggest a lower value of γ such as 2 or 3, while others suggest a value of 10 or higher.; the value chosen is intended to show the results for an asset allocation that comprises a balance of stocks and fixed income assets.
- Income: $10/year of defined benefits was provided to avoid negative infinities when computing utilities.
- Portfolio size: the results shown are for portfolios totaling $100,000; the size chosen doesn't effect the results shown.
- Consumption: consumption was chosen to maximize the utility of consumption weighted by the probability of being alive.
- Stock market returns: arithmetic 7.2%, volatility 17.0%; this reflects world experience for 1900-2000.
- Liability matching bonds: a portfolio of zero coupon inflation-indexed bonds with amounts and durations reflecting the probability the individual is alive at future ages; as the individual ages the duration of the liability matching bonds shrinks, and with it, assuming a static normal yield curve, the liability matching bonds average yield.
- Liability matching bond returns: computed using the U.S. Treasury real constant maturity Treasury yield curve on 2015-12-31 and projected mortality; an interpolating spline is used for durations not reported by the Treasury and durations beyond 30 years are computed using the average forward rate 15 years and over, consistent with Treasury methodology.
- Inflation-indexed income annuity prices: based on the Treasury real yield curve and the Society of Actuaries 2012 Individual Annuity Mortality Basic table with mortality adjusted for contract length using the 2005-08 Individual Payout Annuity Experience Report Table 3a Immediate annuity, nonrefund, 2012IAM "G2 for 5", aggregated according to annual income.
- Static yield curve assumption: The same static duration varying yield curve is assumed to exist throughout time.
- Annuitization: For the model annuitization isn't something that must be performed all at once, but is capable of being performed gradually from one year to the next.
- Money's Worth Ratio: 100%; a value of 100% is consistent with the best observations in the market place.
- Management expenses: 0%.
- Taxes: none.
- Bequest motive: none.
- Time step: a discrete time step of 1 year was used.
- Rebalancing: rebalancing is performed annually to the target allocation, except of course for SPIA holdings which may be increased, but can't decrease.
- The constant force - previously, post age 50, it was necessary to have liquid assets that could provide for both consumption and rebalancing. Prior to age 50 it is now only necessary to have liquid assets that can provide for rebalancing. This means a greater portion of the portfolio can be annuitized.
- The long range force - there are no longer any financial obligations prior to age 50. This means for young ages the duration of liability matching bonds is longer, pushing up their interest rate. This favors liability matching bonds over inflation-indexed SPIAs, particularly at young ages.
Why liability matching bonds? Why now?
I will consider an average bond fund, made up of a mixture of corporates, Treasuries, agency, and muni bonds. Taking into account bond defaults, by my estimate, such a fund earns around 0.7% above the 10 year Treasury yield. As of 2005-12-31, constant maturity 10 year Treasuries were projected to earn 2.3% nominal, which is 0.1% above the Survey of Professional Forecasters 2015Q4 10 year inflation projection. Add to this a premium of 0.7% for the typical bond fund, gives a total expected real return for nominal bonds of around 0.8%. For 1927-2014, the volatility of 10 year constant maturity Treasuries was 9.6%. However, for the buy and hold investor, this is not the volatility we want. The long term buy and hold investor will experience a much lower volatility, similar to the volatility in the CPI, which was 4.1%. Historically the correlation of nominal bonds to stocks has been around 7%.
Plugging the above values in results in the following plot for a stocks, liability matching bonds, regular nominal bonds, and no annuities portfolio.
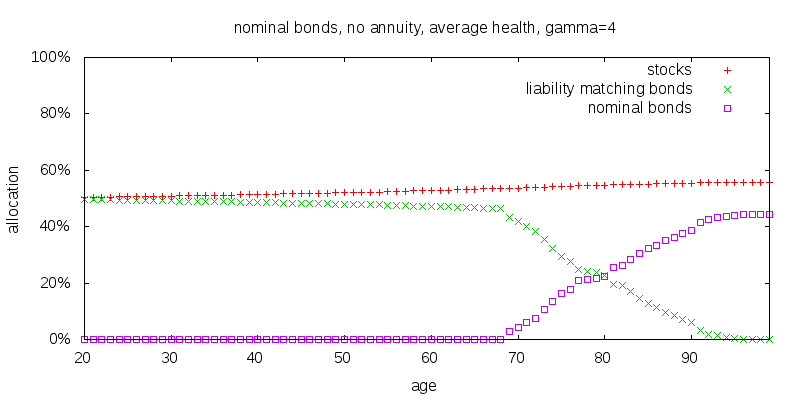
Before getting to the meat of the above figure, first note the slight upward increase in the allocation to stocks. This can be understood with reference to Merton's formula as a side effect of the risk free rate of return gradually declining as the duration of liability matching bonds decreases.
The decline in liability matching bonds, and rise in nominal bonds at around age 70 is a result of the liability matching bonds duration shrinking to the point that the return of nominal bonds is better. But this is misleading, since it is also the age at which the volatility experienced exceeds that of the CPI, since there is no certainty such bonds will be held and consumed long term.
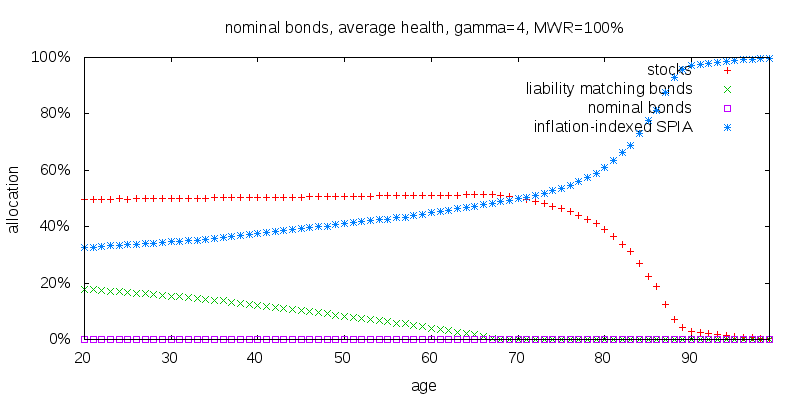
Even if the above were not the case the complete annuitization of the bond portion of a portfolio starting at age 68 makes the presence of nominal bonds at advanced ages moot. This is shown in the following figure in which I also add inflation-indexed SPIAs to the mix.
Repeating the same experiment for 2004-12-31 gives a different result. The 10 year constant maturity returns 4.2%, less 2004Q4 inflation expectations of 2.5%, plus a premium of 0.7% for a typical bond fund, giving 2.4% real. This compares to 2.0% real for a 30 year zero coupon Treasury. Given this, it is no surprise that nominal bonds dominate liability matching bonds as shown in the figure below.
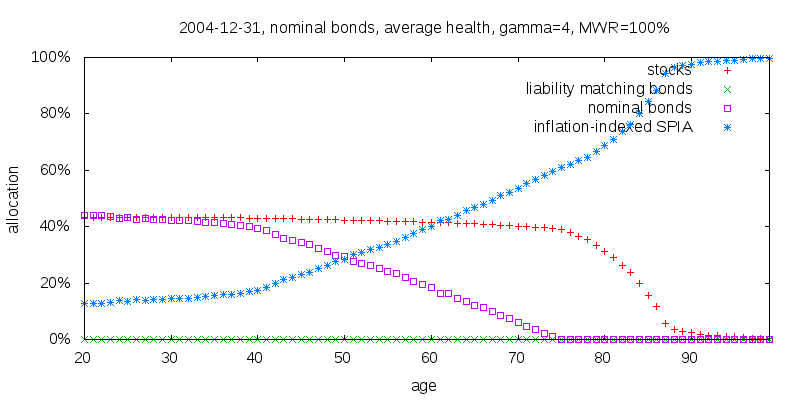
Despite nominal bonds dominating liability matching bonds, the difference between using and not using nominal bonds is not all that great.They provided a 2.2% increase in lifetime certainty equivalent income assuming the 2004-12-31 yield curve. Conversely, using nominal bonds exclusively in place of liability matching bonds caused a 1.1% reduction in lifetime certainty equivalent income when assuming the 2015-12-31 yield curve throughout.
It might be possible to obtain better returns today by switching exclusively to corporate bonds. Quoted yields don't include the cost of downgrades and defaults, so this would need to be factored in. The danger of this however is such bond funds are likely to underperform when there is an economic downturn, which is precisely when they are needed the most.
It is also possible to switch to nominal bonds with a longer duration, say 25 years instead of 10. This would boost expected real returns by about 0.7% to 1.5% based on zero coupon bond yields. Such returns are likely to be competitive with the returns of liability matching bonds. However, the time final period where their volatility makes them inappropriate means they would be inappropriate beyond about age 50. What is worse, and is unable to be captured by my model is an uptick in inflation could seriously erode the real value of such bonds. Long duration inflation-indexed bonds don't have this risk, which is why they are frequently used as liability matching bonds.
In the future the return of nominal bonds may be higher, but so may the return of liability matching bonds. The preference for liability matching bonds over nominal bonds depends on the precise difference between 10 year nominal yields, the spread above the 10 year yield of the typical bond fund, inflation expectations, and the real yield curve for all the durations that matter. This is highly dependent on the economic environment we are in. In the present economic environment liability matching bonds have the upper hand.
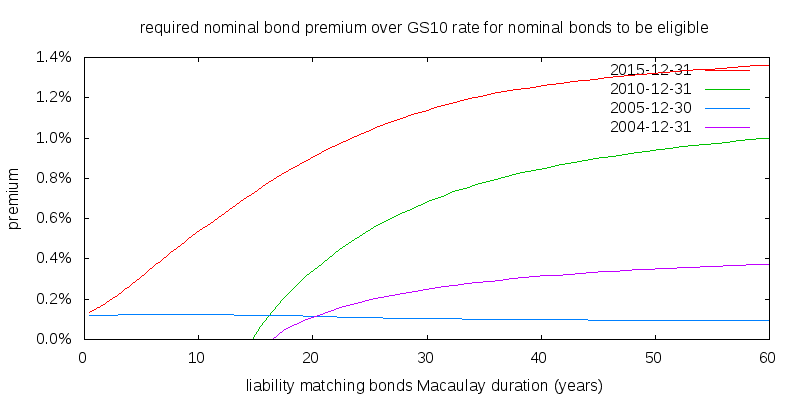
The premium you need to earn on a nominal bond fund over the Treasury 10 year constant maturity note for there to be at least some allocation to nominal bonds is shown in the figure below. Note that the real yield curve for 2005-12-30 was flat. I contend that for the average bond fund the historical premium over the 10 year constant maturity Treasury for has been about 0.7%. I derived this figure looking at the breakdown bonds of different types reported in the Fed's Flow of Funds releases, the BofA option adjusted spreads, and Moody's downgrade and default rates. Based on this estimate you can see there would be no nominal bonds using the 2015-12-31 yield curve when compared against liability matching bonds with durations longer than 14 years, and none for durations longer than 31 years using the 2010-12-31 yield curve, but for the other dates nominal bonds are likely to put in a strong showing. In any event, a 31 year real duration presents no computational difficulties but may prove difficult to obtain in practice. Unfortunately there isn't historical real yield data available to explore the issue of which performs best, bond funds or liability matching bonds outside of the time interval explored. It is likely that they perform reasonably similarly.
Mortality
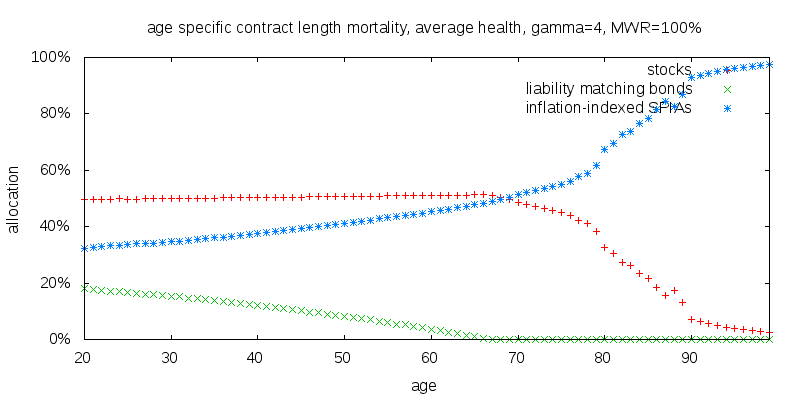
Earlier I alluded to contract length adjustments to mortality. The IAM mortality table I am using lumps all annuitants of a given age together, and doesn't distinguish between an annuitant who just purchased a SPIA contract and presumably is in very good health, and an annuitant who purchased a SPIA contract 20 years ago and whose health is more uncertain. The contract length adjustment is intended to adjust mortality for the length of time a SPIA contract has been held. The recommended strategy generated without making this correction is shown below.
The difference is small, the portion of liability matching bonds initially held has moved from 18 to 19%, and the age at which liability matching bond holding reaches zero moves from 68 to 71.
The most detailed version if the Annuity Experience Report breaks thing down by contract length and age. Their sample size however is too small, introducing noise into the results for advanced ages. This is true even after eliminating the most egregious outlier value from the sample, as shown below. Because of this noise I stick to using the age aggregated contract duration adjustment.
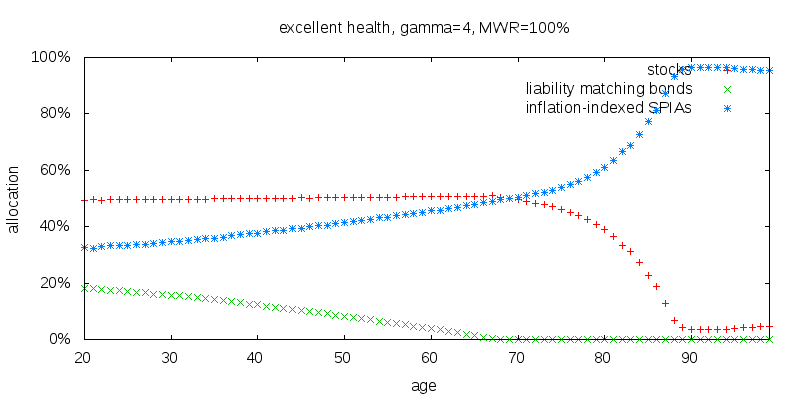
I normally assume the average annuitant is only in average health as given by the Social Security cohort tables, but that annuities are priced using the contract length adjusted Society of Actuaries IAM table, which I consider to denote someone in excellent health. The life expectancy at birth of the hypothetical male is 81.4 using the SSA cohort table, and 89.0 using the IAM table. The results from assuming the individual was in excellent health at birth and using the IAM table with a contract length equal to their age are shown below. There is very little difference between this and the original plot prior to age 90.
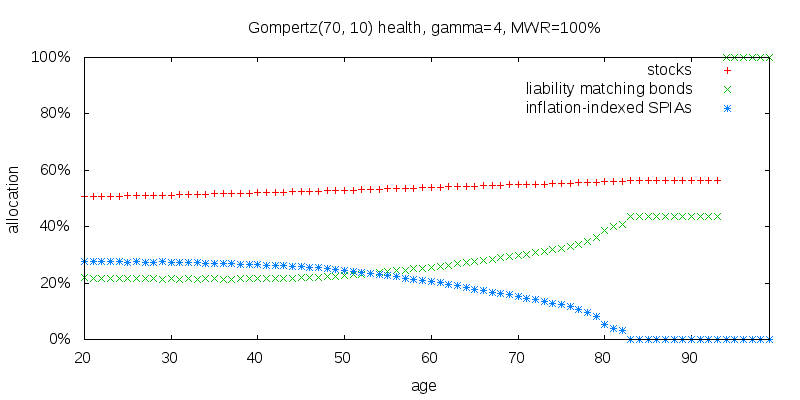
To be sure nothing has gone wrong, the figure below shows the strategy for an artificial Gompertz(70, 10) mortality table. The life expectancy at birth has dropped to 64.5. Note that annuitization is declining. at age 20, the recommended annuitization is 28%, but if by age 70, you haven't purchased any annuities, your life expectancy is now so bleak relative to annuity prices the recommended annuitization is only 15%. In my Gompertz model the probability of death at age 94 is 100%, making the results at and beyond this point meaningless.
Sensitivity to γ
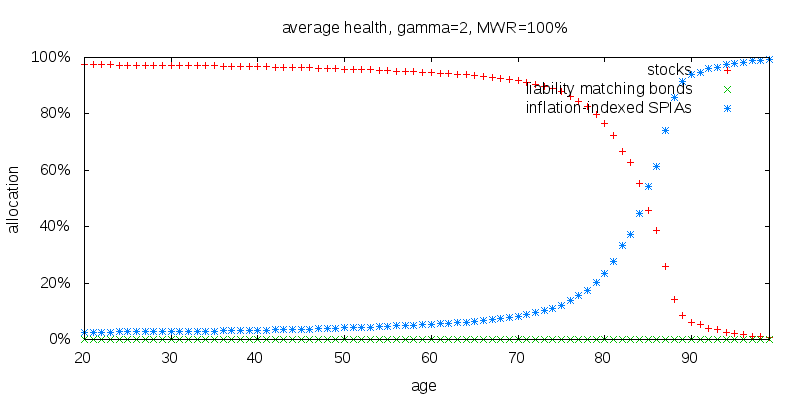
It is important to explore the sensitivity of annuitization to changes in different parameters. The first parameter I will explore is the coefficient of relative risk aversion, γ. A γ of 2 represents a low degree of risk aversion as shown below. No liability matching bonds are ever held, and stocks become fully annuitized at around age 90.
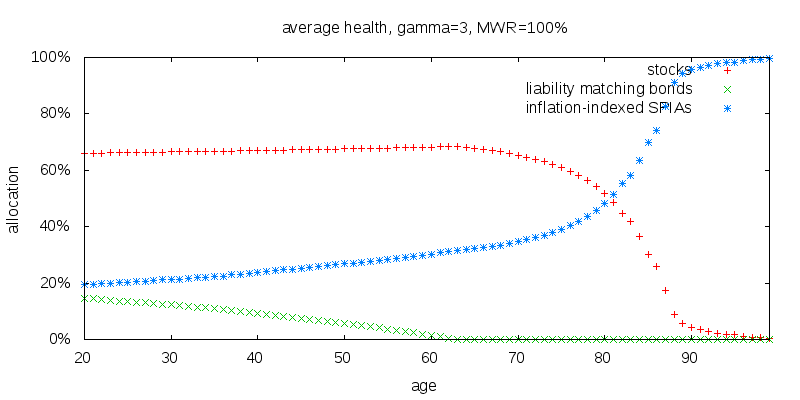
A γ of 3 starts to tell a familiar story as shown below. Note that stock holdings are initially significantly higher than they are in the default case of a γ of 4. Despite this the holdings of liability matching bonds are similar. Initially 15% instead of 18% at age 20, and dropping to zero at age 63 instead of age 68.
Increasing γ all the way up to 6, stocks fall, annuitization rises, but liability matching bonds stay much the same, starting at 17% at age 20, and falling to zero at age 71 as shown below.
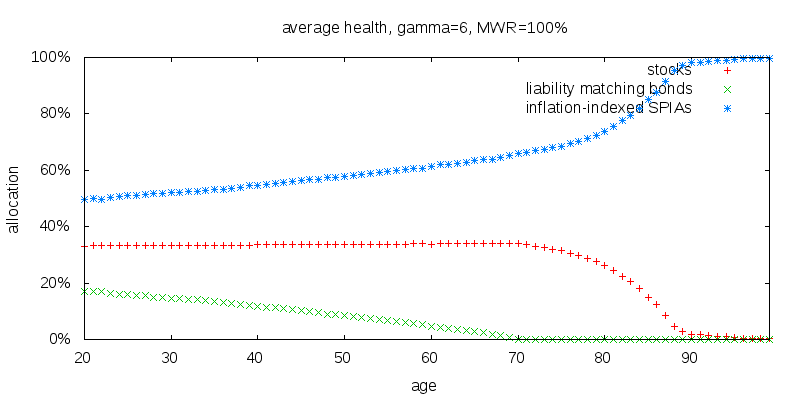
The reason for the lack of sensitivity of liability matching bond holdings to changes in γ is liability matching bonds are not there as a risk offsetting holding, SPIAs perform that role, but as a vehicle that offsets stocks and allows them to rebalance.
Liability matching bonds can be considered as a risk free asset. Merton's formula does a good job of predicting the holdings of stocks as shown in the following table. It should be noted that Merton's formula assumes lognormally distributed returns whereas I use returns shaped according to the observed historical returns distribution.
| stocks at age 20 | γ | ||||
|---|---|---|---|---|---|
| 2 | 3 | 4 | 5 | 6 | |
| Recommended allocation | 98% | 66% | 50% | 40% | 33% |
| Merton's formula prediction | 104% | 69% | 52% | 42% | 35% |
Sensitivity to expected market returns
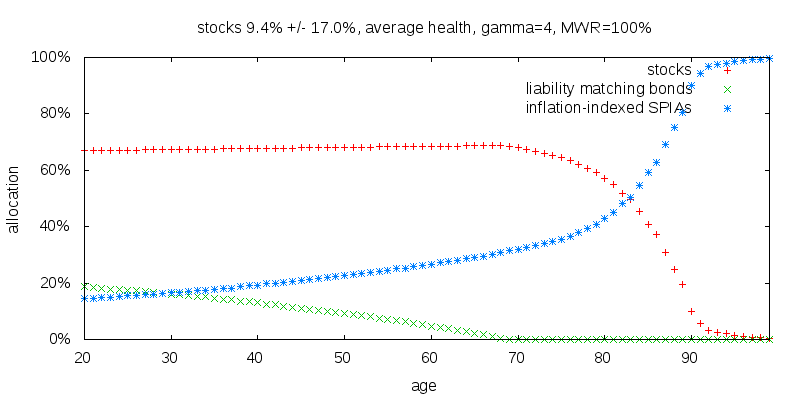
The following figure shows what happens when I increase the expected arithmetic return on stocks from 7.2% to 9.4%, well within the bounds of two standard errors of its observed value; and the upper bound of an 80% confidence interval of its true value. As expected the holding of stocks rises, but the holdings of liability matching bonds appears virtually unchanged.
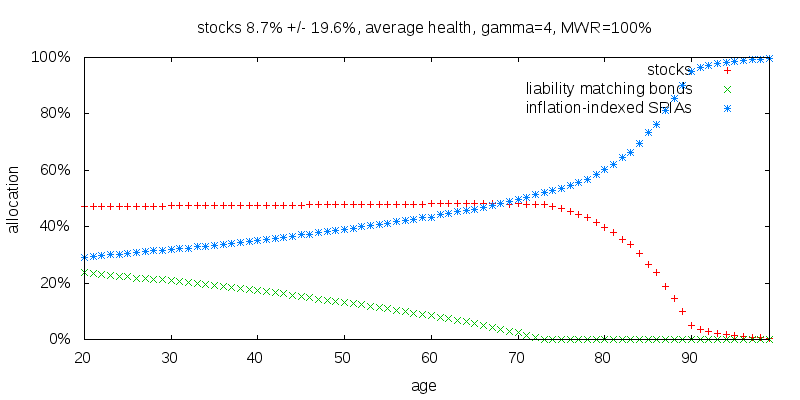
Next I consider switching from returns indicative of world stock market experience, 7.2% +/- 17.0% volatility, to returns indicative of the U.S. stock market from 1927-2014, 8.7% +/- 19.6%. This is shown below. Note that despite the increased return, stock holdings have decreased slightly on account of the offsetting increased volatility. This is consistent with Merton's formula. More significantly liability matching bonds holdings have increased. This is the smoking gun that the role of liability matching bonds is a buffer in the event that stocks do poorly and rebalancing is necessary. Increase the volatility of stocks and the need for liability matching bonds increases.
Money's Worth Ratio
So far I have been assuming a MWR of 100% against the Treasury real yield curve. This was reasonable in 2015 for inflation indexed SPIAs from the AIG provider American General in the absence of state taxes. A value of 95% appeared more appropriate for a higher credit rated provider such as Principal Financial Group in the absence of state taxes.
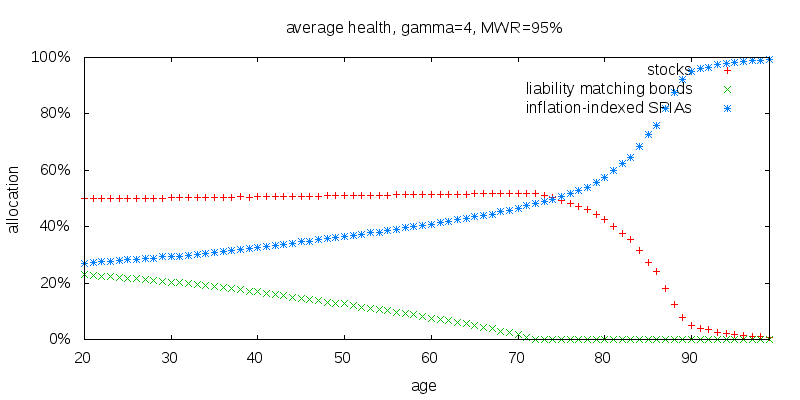
The figure below shows the results for an MWR of 95%. Stocks are largely unchanged, although they become almost fully annuitized at age 90 instead of age 89. More significantly liability matching bonds have increased and SPIAs decreased. Holdings of liability matching bonds have increased from 18% to 23% at age zero, and reach zero at age 72 instead of 68. This makes sense since SPIAs are less valuable. The magnitude of the change is small, suggesting the annuitization strategy shouldn't be driven by the precise MWR.
Real yield curve
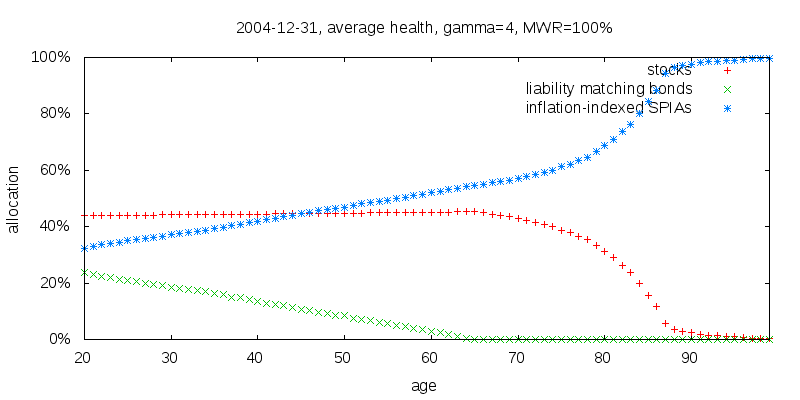
We are in uncommon monetary times, with low real yields. The 5 year TIPS note yields 0.5% while the 30 year TIPS bond yields 1.3%. Eleven years ago on 2004-12-31, the 5 year note yielded 1.0%, and the 20 year bond 2.0%, with data for a 30 year note not being available. Eleven years ago is more indicative of typical times. I choose to use 11 years ago because for 10 years ago the real yield curve was flat. The figure below shows the strategy to be employed assuming a static yield curve matching that of 2004-12-31. Stock holdings are lower, and became close to fully annuitized at age 87. Liability matching bond holdings start at 24% at age 20, and fall to zero at age 66. This is as expected; higher liability matching bond holdings than in the present time. Again however, the magnitude of the change is small.
Sex
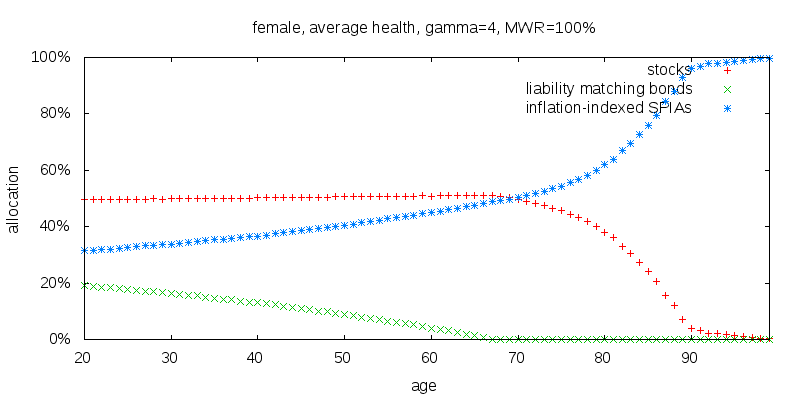
The figure below shows the results for a female instead of a male. The results are very similar. Stocks become close to fully annuitized at age 90. Liability matching bond holdings start at 19% at age 20 and fall to zero at age 68.
Retirement age
To keep things simple I have been considering a retirement age of zero. Obviously this is far from realistic, but was done for pedagogical purposes. The figure below shows the recommended strategy for a retirement age of 50.
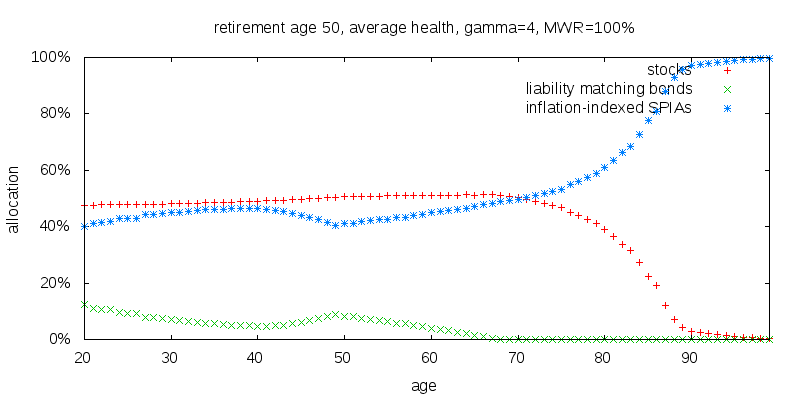
Broadly speaking the recommendations are similar to before, but there are some differences. Post age 50 the recommendations are identical to before. Prior to age 50 there are two counteracting forces:
The constant force explains why SPIA levels are higher prior to age 50 than they would be for a retirement age of zero. Equivalently it explains the dip in liability matching bond levels at age 40.
The long range force is harder to discern in the above plot, but is obvious in the plot below which shows the recommended strategy for a retirement age of 70.
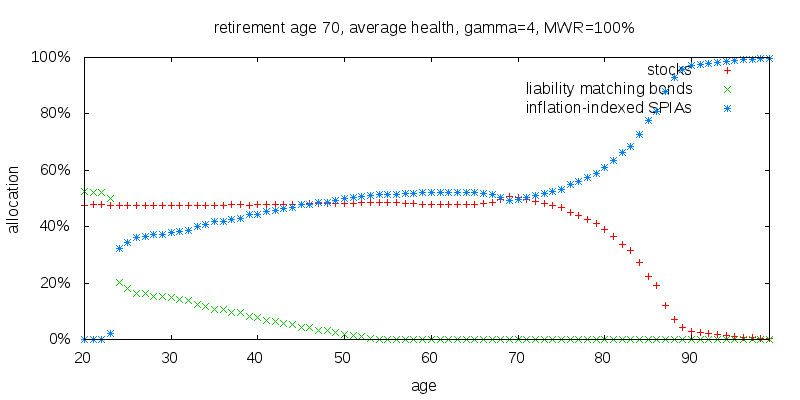
Once again the annuitization curve prior to age 70 has moved up. Below age 24 something new is observed. There are almost no SPIAs held. I presume this is the long range force in action. The effective return of SPIAs simply isn't competitive with that on liability matching bonds. It is a very sharp transition. This can be understood as thinking of liability matching bonds and SPIAs as risk free assets. Either one of them has a better rate of return, or the other, and it is all one or all the other, except that when SPIAs are favored, then there is still a need for liability matching bonds for rebalancing purposes.
Optimal versus good enough
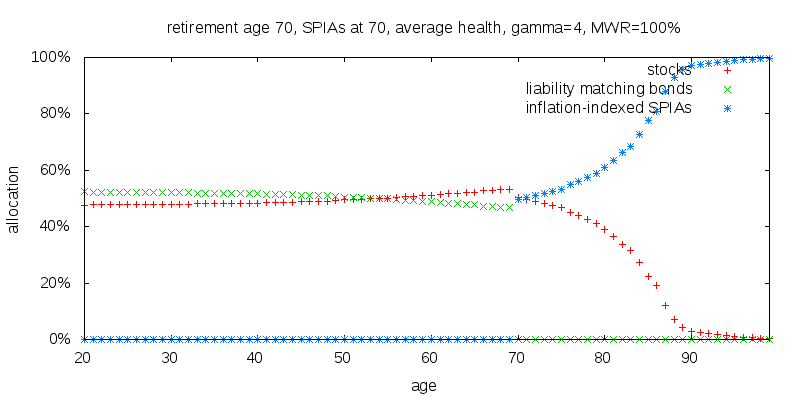
So far I have focused on trying to find the optimal strategy, which shows the fixed income portion of a portfolio being annuitized very early, but what if the optimal strategy is only marginally better than some other simpler strategy. I will consider the effect of only allowing SPIAs to be purchased on or after some age. For this I employ the concept of a trust fund baby. An individual that starts out with money at birth, invests it according to the recommended strategy, and then draws on it in retirement. I consciously chose this approach rather than the alternative approach of an individual that starts with no assets and accumulates them over time according to a fixed schedule, because expected future savings counts as a virtual fixed income like asset that would offset other fixed income holdings. The figure below provides an example of strategy for a trust fund baby retiring at age 70 and only able to start purchasing annuities at age 70.
The table below shows the relative retirement certainty equivalent consumptions obtained for different retirement and annuitization starting ages.
| consumption CE | annuitization starting age | ||||||||
|---|---|---|---|---|---|---|---|---|---|
| 0 | ... | 40 | 50 | 60 | 70 | 80 | 90 | none | |
| retire at 50 | 100.0% | ... | 98.8% | 97.3% | 95.4% | 93.7% | 92.0% | 89.4% | 83.0% |
| retire at 70 | 100.0% | ... | 99.8% | 99.3% | 97.7% | 94.5% | 90.5% | 84.6% | 71.4% |
As can be seen, a good case can be made for annuitizing some assets 10 years prior to retirement for retirement at age 50, and 20 years prior to retirement for retirement at age 70. Despite being the optimal strategy, the case for annuitization any earlier than this is weak. The optimal strategy recommends SPIAs be purchased prior to retirement. Deferred income annuities would be more appropriate, except that presently in the U.S. the Money's Worth Ratios on deferred income annuities are significantly worse than those on SPIAs. I would like to be able to recommend delaying annuitization until retirement, but for someone retiring at age 70 this means foregoing 5.5% of their retirement consumption, which is substantial.
Repeating the above experiment but with no liability matching bonds held after the annuitization starting age produced a relative certainty equivalent consumption of 98.7% for retiring at 50 with annuitization starting at 40, and 99.3% for retirement at 70 with annuitization starting at 50. In other words there is essentially no loss in switching from stocks and liability matching bonds to a simple stocks and inflation-indexed SPIAs strategy once annuitization begins, and not worrying about also holding liability matching bonds.
Recall that for many individuals Social Security or other defined benefits will form the most substantial part of their total assets, and so the recommendation that they fully annuitize their fixed income assets is readily satisfied.
Year of birth
All of the figures so far have been for an individual born in 2016. Were I to repeat the present work, I would choose an earlier date. The figure below is for an individual born in 1940, currently aged 76, and expected to be just starting to annuitize stocks. I had expected some difference, since an individual born today will live longer, but the extent of the difference surprised me. Whereas someone born today might annuitize bonds from age 75 to 90, an individual born in 1940 might annuitize them from ages 65 to 90.
An individual born in 1965 would be 51 today, and thus around the age where they might be expected to annuitize fixed income assets. The following table shows the certainty equivalent consumption they would receive if they switched from liability matching bonds to inflation-indexed SPIAs at the annuitization age, relative to employing the optimal mixed strategy from birth. As can be seen there is some degradation in performance relative to being born today, but not enough to alter the recommended strategy. A good case can still be made for annuitizing fixed income assets 10 years before retirement if retiring at 50, and 20 years before if retiring at 70.
| consumption CE | annuitization age | ||||||||
|---|---|---|---|---|---|---|---|---|---|
| 0 | ... | 30 | 40 | 50 | 60 | 70 | |||
| mixed strategy | pure fixed income strategy | ||||||||
| retire at 50 | 100.0% | ... | 99.3% | 98.3% | 96.3% | 93.5% | 90.7% | ||
| retire at 70 | 100.0% | ... | 99.8% | 99.5% | 98.7% | 96.0% | 90.8% | ||
Cost of delay
When deciding whether to annuitize what matters is not only the savings from doing so, but also understanding the magnitude of any cost of delaying the decision to annuitize.
So far I have only considered annuitization of an initial portfolio that evolves from birth. Here I will do something different. The reduction in certainty equivalent consumption from delaying the ability to annuitize by 10 years for a retired individual with a fixed initial portfolio size starting at a given age is shown in the table below. Mixed liability matching bonds and income annuities portfolios were allowed in both cases.
| starting age | 30 | 40 | 50 | 60 | 70 | 80 | 90 |
|---|---|---|---|---|---|---|---|
| year of birth | 1975 | 1985 | 1965 | 1955 | 1945 | 1935 | 1925 |
| reduction in CE from delaying
start of annuitization by 10 years |
1.3% | 1.8% | 2.9% | 4.9% | 9.3% | 22.1% | 39.1% |
Nominal SPIAs
So far I have only considered inflation indexed SPIAs. Nominal SPIAs are far more popular. How might they perform?
Nominal SPIAs are harder to price, since they are largely backed by corporate bonds of differing qualities. I priced them using the yield curve for nominal constant maturity Treasuries plus 1.4%. This 1.4% was appropriate on 2015-12-31, and appears to be correspond to the BofA Merrill option adjusted spread for A credit rated bonds. Pricing nominal SPIAs in this way I found an MWR of 95 to 100% for quotes from ImmediateAnnuities.com.
To make the model of nominal SPIAs work it is necessary to come up with an estimate of inflation, and reduce the real income provided by the nominal SPIAs by that amount each year. I used 2.3% with a stochastic volatility of 4.1%. This corresponds to a geometric value of 2.2% which is the Survey of Professional Forecasters 2015Q4 10 year forecast, and the historical CPI volatility for 1927-2014. Volatility today is probably lower.
The results for an MWR of 95% are shown below. Nominal SPIAs make a strong presence and liability matching bonds barely get a look in.
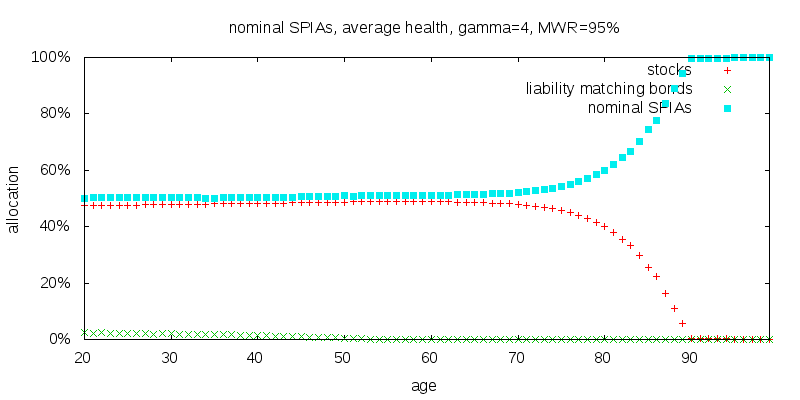
For a $100,000 portfolio at birth the lifetime certainty equivalent consumption level was $3,260 compared to $3,104 when using inflation-indexed SPIAs with an MWR against the Treasury real yield curve of 100%.
Nominal SPIAs outperform inflation-indexed SPIAs in a comparison that intentionally favored inflation-indexed SPIAs, so why aren't they recommended? This is because in our model inflation varied randomly with a volatility of 4.1%. One year it might be 6%, the next -2%, and the year after that 0%. In reality inflation is sticky, if one year it is 6%, the next it might be 5%, and the year after that 6%. This could have a devastating effect on the value of a inflation-indexed SPIA. Modeling this would be challenging, both in terms of the computational demands imposed by such a model, and in terms of attempting to build a model that accurately captures this stickiness.
The bottom line
To understand why annuitization is valuable I consider retired individuals with fixed initial portfolio sizes and look at the amount by which their future certainty equivalent consumption is increased by their ability to annuitize all or part of the portfolio.
| consumption CE improvement | starting age | ||||
|---|---|---|---|---|---|
| 50 | 60 | 70 | 80 | 90 | |
| with liability matching bonds when able to annuitize | 18% | 24% | 33% | 54% | 101% |
| without liability matching bonds when able to annuitize | 18% | 24% | 33% | 54% | 101% |
Clearly the ability to annuitize matters a great deal, and it matters more and more the older you get. The ability to balance between liability matching bonds and inflation indexed SPIAs almost doesn't matter at all, at least not post retirement.
Conclusion
We threw a lot of different parameters at the problem and by and large the results more or less came back the same. This allows us to make some reasonably general rule of thumb recommendations. These recommendations apply to the total portfolio, including Social Security and other defined benefits. Applying them to just the portion of the total portfolio that is in liquid assets would be a mistake.
Stocks. In a balanced stock, liability matching bond, inflation-indexed SPIA portfolio stock holdings should correspond to the fraction predicted using Merton's formula based on the value of γ used:
stocks fraction = (μ - r) / (σ2 γ),
where μ is the expected arithmetic return on stocks, r is the present liability matching bonds average rate of return, σ is the volatility of stock returns, and γ is the coefficient of relative risk aversion.
Stock annuitization. I suggest annuitizing stocks on a straight line basis from age 65 to 90 assuming an MWR of 100%. In reality annuitization won't be performed annually, but in one or two chunks over the time period.
Fixed income. The portion of the total assets that isn't allocated to stocks forms the fixed income assets: liability matching inflation-indexed bonds and inflation-indexed income annuities. The allocatable portion of fixed income assets consists of the total fixed income assets less the net present value of Social Security and other defined benefits.
Liability matching inflation-indexed bonds. That is inflation-indexed bonds with a duration matching retirement financial obligations. These weren't considered in my previous study. In the present economic environment I found them to dominate regular nominal bonds, and I would recommend them in place of regular nominal bonds. This is not always the case, although the difference between using one and the other does not appear too great. Prior to fixed income anuitization, holdings of liability matching inflation-indexed bonds should amount to 100% of fixed income assets.
Inflation-indexed income annuities. Ignoring the need for any emergency funds, post fixed income annuitization, inflation-indexed income annuities, that is SPIAs and deferred income annuities, should make up 100% of fixed income assets.
Fixed income annuitization. Fixed income annuitization involves the switch from holding liability matching inflation-indexed bonds to inflation-indexed income annuities. Annuitization should commence 10 years before retirement for a retirement age of 50, or 20 years before for a retirement age of 70. Deferred income annuities make the most logical sense, although in the U.S. they currently appear prohibitively expensive. This annuitization isn't necessarily a one shot event. Depending on stock market performance and cashflows, there may be a case to annuitize additional assets down the road prior to the scheduled annuitization of stocks. Delaying fixed income annuitization until retirement means foregoing either 3.7% or 9.2% in retirement certainty equivalent consumption for retirement ages of 50 and 70. This might be acceptable to some, but isn't to me.