Variable Withdrawal Utility Function Sensitivity
Asset allocation via Stochastic Dynamic Programming (SDP) in the presence of variable withdrawals, as well as the theoretical work of Samuelson and Merton, suggest the optimality of a fixed static asset allocation from a retirement portfolio when a Constant Relative Risk Aversion (CRRA) utility function is used to value consumption welfare. Here we test the robustness of this result when a Constant Absolute Risk Aversion (CARA) utility function is used instead.
We consider a retired couple both aged 65 with a $500,000 portfolio and $20,000 in annual Social Security income as described more fully at the end of this note. Their relative risk aversion coefficient, η, is 3.0.
Utility
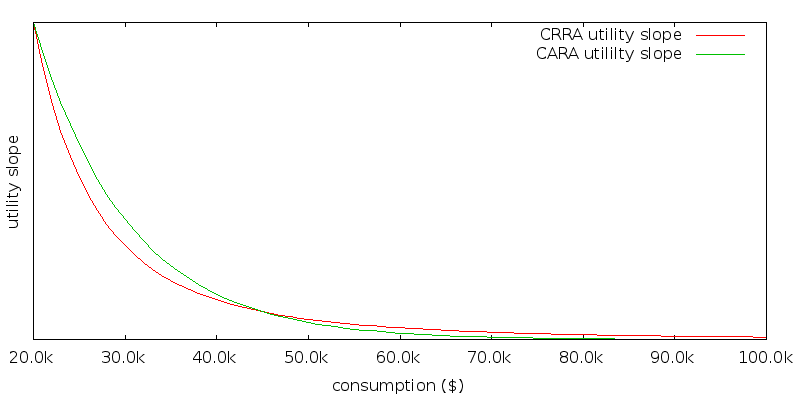
In order to perform a fair comparison, we desire that the CARA utility function have the same slopes at $20,000 and $45,000 as the CRRA utility function. The slope of a utility function represents the impact of a marginal dollar. Our choice of $45,000 is somewhat arbitrary, but it represents the fixed withdrawal amount when performing asset allocation using SDP that results in the highest lifetime certainty equivalence for our scenario. Since utility functions are invariant over the scale used on the y axis, what we are really saying is that the ratio of the slopes at consumptions c1 and c2 should be the same for the CARA and CRRA utility functions. Ucrra(c) = (c1 - η - 1) / (1 - η). Ucara(c) = 1 - e-αc. We want Ucrra'(c1) / Ucrra'(c2) = Ucara'(c1) / Ucara'(c2). Solving gives α = η log(c2/c1) / (c2 - c1) = 9.73x10⁻⁵.
The slopes of the two utility functions are plotted below. The x-axis starts as $20,000. As expected the slopes are equal at $20,000 and $45,000. At a glance the difference between the two utility functions might appear relatively minor. CARA values consumption above $45,000 less than CRRA, and consumption below $45,000 more.
Portfolio paths
Sample portfolio paths for the best asset allocation and withdrawal rate generated using SDP with a CRRA utility function are shown below. This is intended to allow the region of portfolio sizes of interest to be identified.
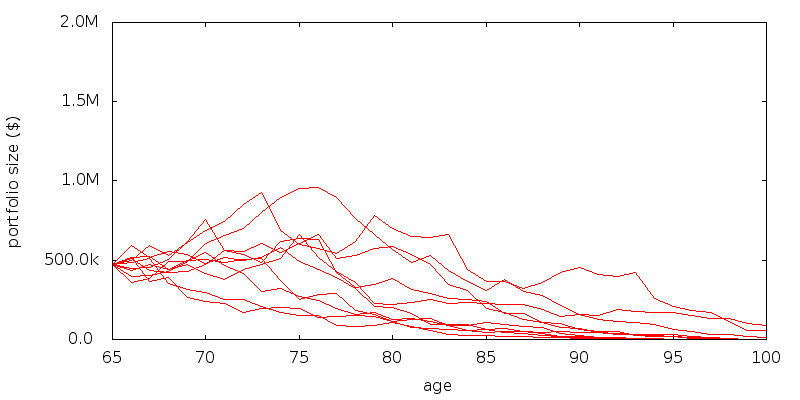
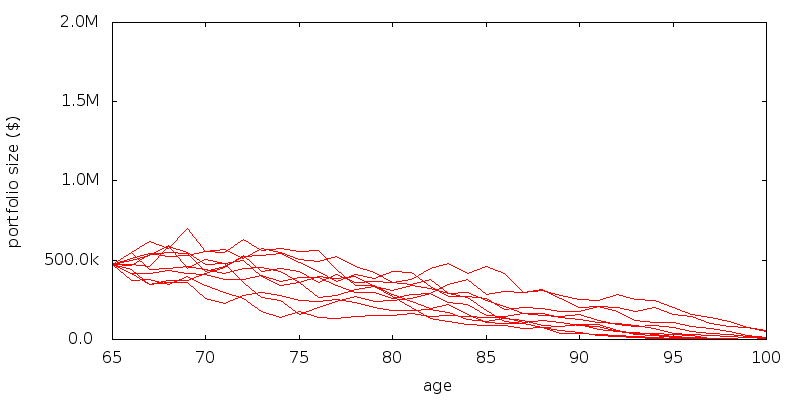
For a CARA utility function the paths are a lot less volatile:
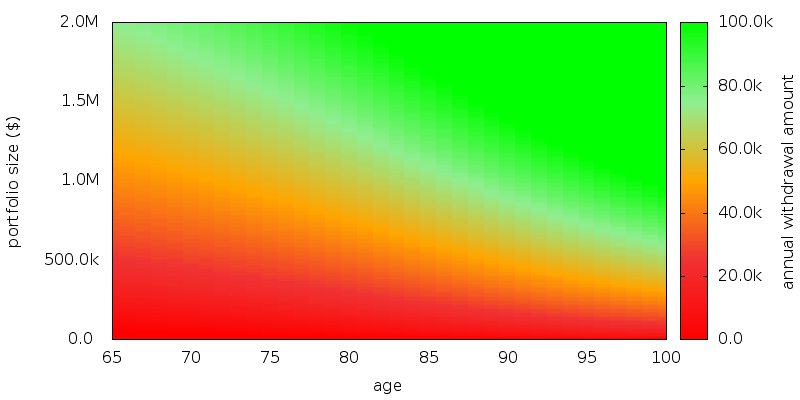
Withdrawal maps
The withdrawal map for CRRA:
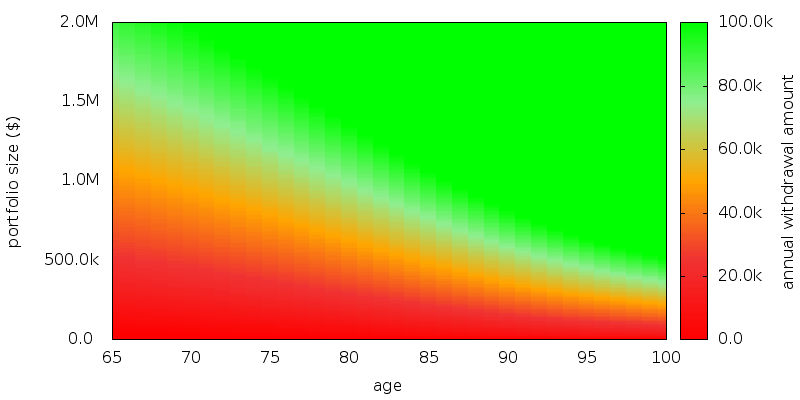
The withdrawal map for CARA shows withdrawals are less:
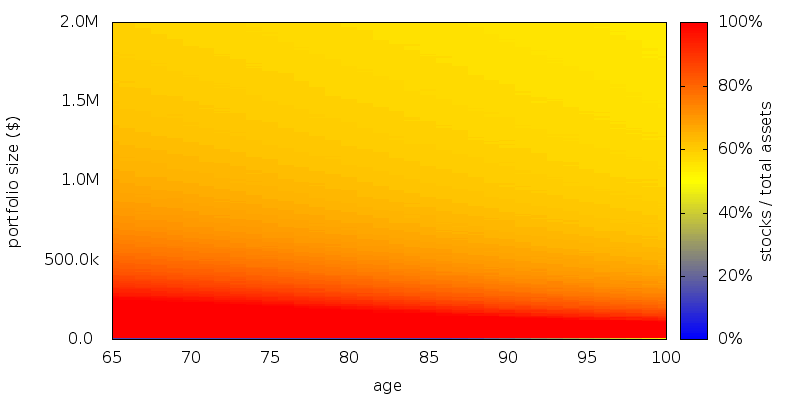
Asset allocation
The asset allocation map for CRRA shows a relatively fixed asset allocation as shown below. In the region of interest of interest for CRRA we observe 70-100% stocks.
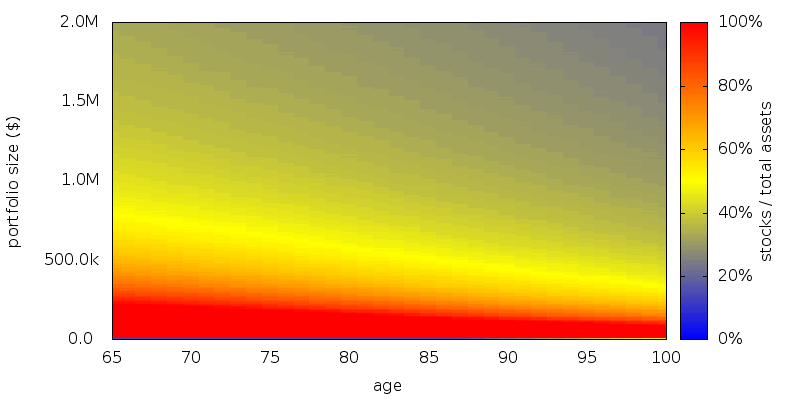
While the asset allocation map for CARA shows fewer stocks, and more variability as shown below. Despite this increased variability, because the paths for CARA are less volatile, in the region of interest we observe 60-90% stocks for CARA.
Generality
These results are not fully general. Take as an extreme case a CARA utility function with CRRA / CARA equivalence occurring at $200k instead of $45k:
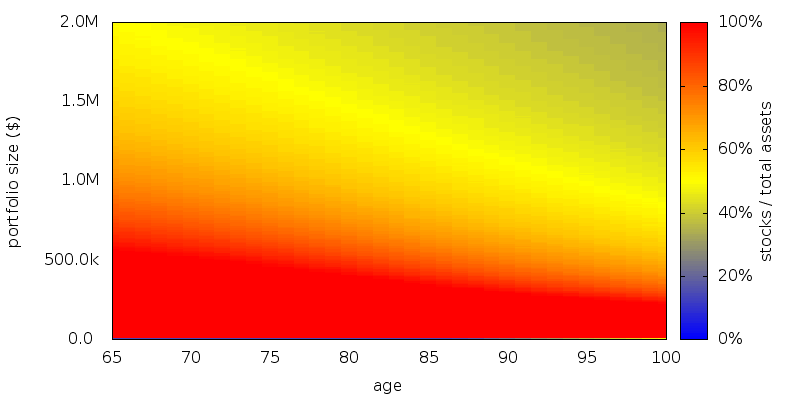
Here the slope of the utility function is very flat across the range of interest. Hence there is little to be lost of the portfolio comes up short, and so stocks are a better bet in the region of interest.
Conclusion
The choice of utility function family makes some difference to asset allocation. If bonds were risk free and assets shortable, CRRA would presumably give a fixed asset allocation as predicted in theory. They are not risk free, and so the CRRA asset allocation is only close to fixed. Using a utility function other than CRRA, such as CARA, asset allocation across the full range of possible portfolio sizes moves further away from fixed, but this might not matter so much because the region of interest in CARA is narrower. Because CARA penalizes downside more and doesn't value upside as much, it tends to withdraw less, tilt slightly towards bonds, and have less volatile portfolio paths than CRRA.
Consumption utility is expected to exhibit decreasing absolute risk aversion, and CRRA exhibits this. Because CARA by definition has constant absolute risk aversion it is neither increasing or decreasing, and it might thus represent the most extreme case of a realistic utility function. Going in the other direction a utility function with a greater decreasing absolute risk aversion than CRRA is likely to be more stock heavy, but there isn't much further in the stock heaviness direction that you can go. Hence the choice of utility function that fits a given pair of utility slopes might not might not make much difference to the optimal asset allocation and withdrawal results.
Scenario
Scenario. A retired male/female couple, both age 65 with a $500,000 portfolio. $20,000 of guaranteed Social Security income is assumed. Longevity is as specified by the U.S. Social Security Cohort Life Tables for a person of the given initial age in 2013. No value is placed on any inheritance that is left. No additions to the portfolio are permitted, and withdrawals are made using the current asset allocation. Taxes were ignored. No transaction costs were assumed for rebalancing, sales, or purchases. All amounts are adjusted for inflation. No time discounting of the future is performed.
Asset allocation schemes: Rebalancing is performed annually. Returns data for 1927-2012 were used by SDP to generate the schemes. A zero consumption level of $0 was used, with 0% phase out with increasing income.
Withdrawal schemes: Withdrawal are performed annually at the start of the year.
Asset classes and returns: U.S. stocks and 10 year Treasuries as supplied by Shiller (Irrational Exuberance, 2005 updated) but adjusted so the real return on stocks is 5.0% and bonds 2.1% before expenses. Management expenses are 0.1%.
Evaluation: For each retirement number value 100,000 returns sequences were generated by selecting returns at random from the period 1927-2012. In evaluating each sequence we compute the full range of longevity possibilities.
Platform: An internal command line version of AACalc.com was used to generate the strategies and simulate the portfolio paths.