Variable Withdrawals When Leaving a Bequest
Asset allocation via Stochastic Dynamic Programming (SDP) in the presence of variable withdrawals is typically stock heavy. What effect might a desire to leave an bequest have on this result?
Methodology
We consider a retired couple both aged 65 with a $500,000 portfolio and $20,000 in annual Social Security income as described more fully at the end of this note.
We value a bequest using a linear utility function, such as might be appropriate when making a charitable donation. We specify that $1 of bequest has a utility equal to 20% of the value of an incremental dollar of consumption received at a consumption level of $45,000. Our choice of $45,000 is somewhat arbitrary, but it represents the fixed withdrawal amount when performing asset allocation using SDP that results in the highest lifetime certainty equivalence for our scenario.
Results
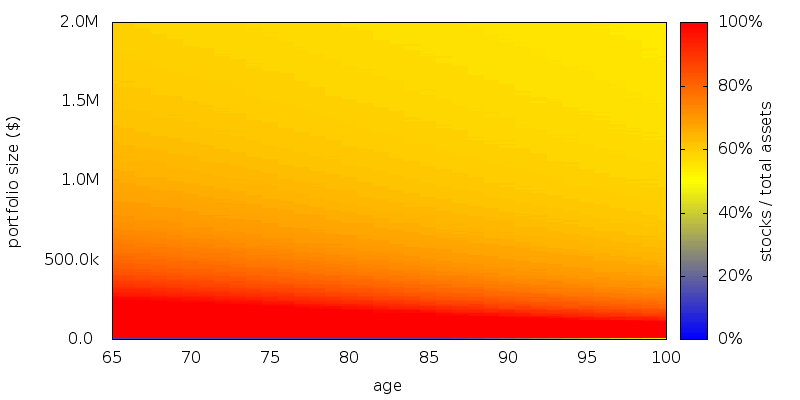
Without any value placed on a bequest the asset allocation for this scenario is shown below:
When we value leaving a bequest:
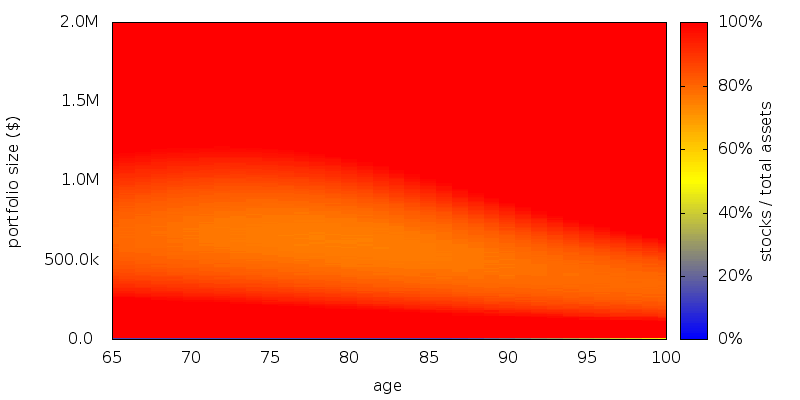
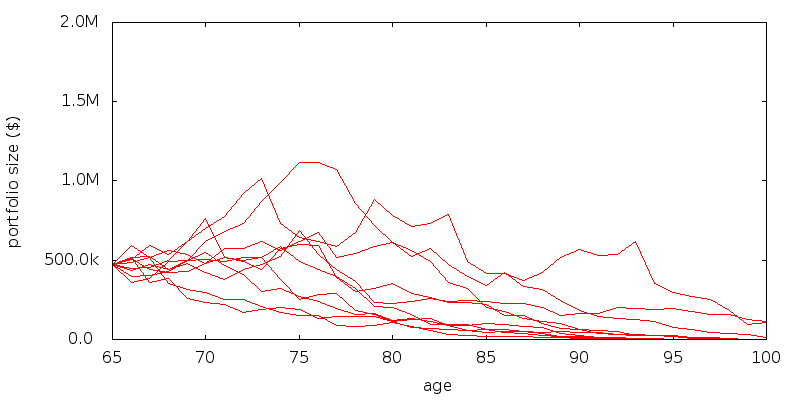
The most important thing to note is that leaving a bequest increases the stock heavy nature of our already stock heavy asset allocation. The asset allocation contains a band where stocks should be around 80%. Outside of this band stocks are 100%. Below is where poor performance is almost guaranteed and stocks simply have a higher payoff than bonds. Above is where betting on stocks increases the value of any bequest. A significant portion of the region of interest lies within the band, as shown by the example portfolio paths below. Had the initial portfolio size been larger or smaller this would not have been the case,
It is reasonable to assume that a bequest that occurs sooner is valued more than one that is made later. We can consider applying a discount rate to the value of any bequest. Since in the present scenario the stock market returns 4.9% geometric real return per year after expenses, it is reasonable to assume that if we apply a discount rate greater than this then the value of a bequest will no longer dominate asset allocation decisions at large portfolio sizes.
The asset allocation for a bequest discount rate of 10% is shown below.
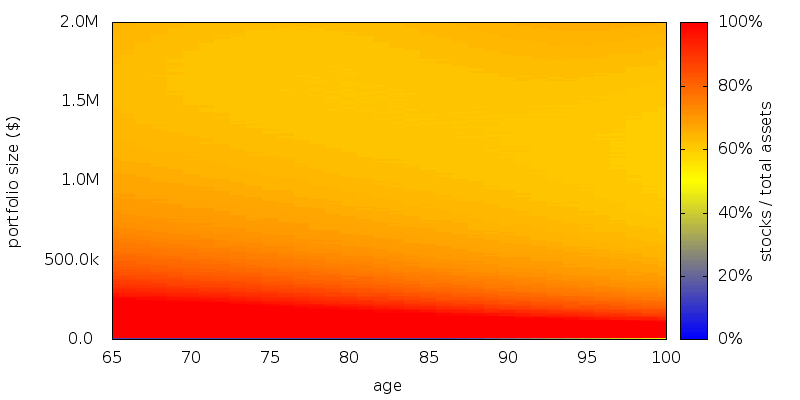
This largely restores the asset allocation to that present in the absence of a bequest. Despite this our use of a discount rate isn't entirely satisfying. Since we are discounting the 20% value of a bequest for each year beyond age 65, it isn't unreasonable to believe that we can do the reverse for ages prior to 65. If we do so then we get the nonsensical result that a dollar of bequest at age 25 would be 900% more valuable than an incremental dollar of consumption at $45,000.
Conclusion
For variable withdrawals leaving a bequest leaves the asset allocation the same or increases the stock heavy nature of an already stock heavy asset allocation.
Scenario
Scenario. A retired male/female couple, both age 65 with a $500,000 portfolio. $20,000 of guaranteed Social Security income is assumed. Longevity is as specified by the U.S. Social Security Cohort Life Tables for a person of the given initial age in 2013. No additions to the portfolio are permitted, and withdrawals are made using the current asset allocation. Taxes were ignored. No transaction costs were assumed for rebalancing, sales, or purchases. All amounts are adjusted for inflation. No time discounting of the future is performed for consumption.
Asset allocation schemes: Rebalancing is performed annually. Returns data for 1927-2012 were used by SDP to generate the schemes. A zero consumption level of $0 was used, with 0% phase out with increasing income. We optimize a power utility function with a coefficient of relative risk aversion of 3.
Withdrawal schemes: Withdrawal are performed annually at the start of the year.
Asset classes and returns: U.S. stocks and 10 year Treasuries as supplied by Shiller (Irrational Exuberance, 2005 updated) but adjusted so the real return on stocks is 5.0% and bonds 2.1% before expenses. Management expenses are 0.1%.
Evaluation: For each retirement number value 100,000 returns sequences were generated by selecting returns at random from the period 1927-2012. In evaluating each sequence we compute the full range of longevity possibilities.
Platform: An internal command line version of AACalc.com was used to generate the strategies and simulate the portfolio paths.