The Cost of Safety
When building a retirement portfolio for fixed withdrawals, the first dollars of the portfolio will have the biggest impact on your retirement success, and the last dollars the least. This is because the last dollars get spent only if the first dollars are inadequate due to either poor portfolio performance or a long life span. This much is obvious, what is less obvious is the speed, extent, and location of the transition from "first dollar" to "last dollar".
For concreteness we consider a person retiring at age 65, making annual withdrawals of $50k, and rebalancing annually according to an portfolio size dependent asset allocation scheme, as described in more detail at the end of this article. For this scenario the probability of any portfolio failure versus the portfolio size at retirement is shown below.
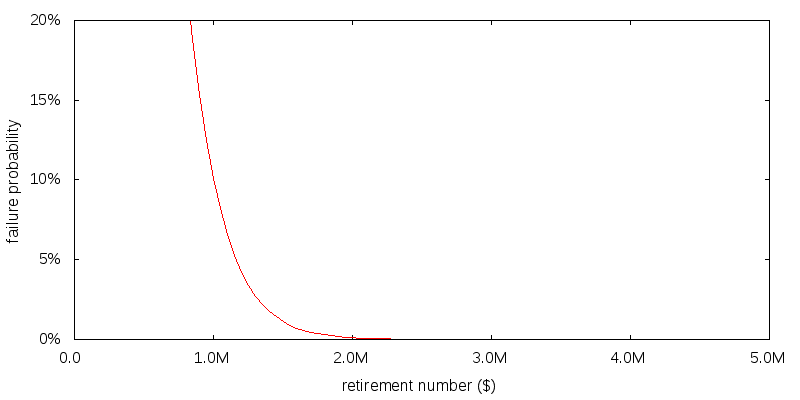
What is interesting is how steep the curve is. Until a failure probability of about 4% the curve is virtually a straight line. Every dollar in retirement funding you make will add proportionately to retirement success. But below about 1% the curve has flattened out horizontally. This means it is difficult for those seeking absolute portfolio success according to the historical data; they must save twice as much as someone who is willing to accept a 4% chance of portfolio failure.
Scenario. A retired 65 year old male withdrawing a fixed real $50,000 per year. Longevity is as specified by the U.S. Social Security Cohort Life Tables for a person of the given initial age in 2013. No value is placed on any inheritance that is left. Withdrawals are made using the current asset allocation. Taxes were ignored. No transaction costs were assumed for rebalancing or sales. All calculations are adjusted for inflation.
Asset allocation scheme. Rebalancing is performed annually. Stochastic Dynamic Programming is used to produce the asset allocation scheme. The optimization function was to maximize a power utility function on consumption. A zero consumption level of $10,000 was used, with 50% phase out with increasing income. The annual withdrawal amount had a utility 100 times the zero consumption level. The exact utility function used shouldn't matter as utility is effectively bi-valued. Returns data for 1872-1926 were used to generate the asset allocation map.
Asset classes and returns: U.S. stocks and 10 year Treasuries as supplied by Shiller (Irrational Exuberance, 2005 updated) but adjusted so the real return on stocks is 5.0% and bonds 2.1% before expenses. Management expenses are 0.5%.
Evaluation: For each retirement number value 100,000 returns sequences were generated using bootstrapping by concatenating together blocks of length 20 years chosen at random from the period 1927-2012.
Platform: AACalc.com was used to generate the results.